
Building Vibration
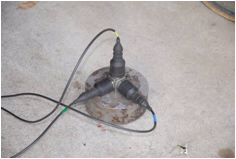
Figure 1. Three accelerometers arranged in a tri-axial fashion, and used to measure building vibration.
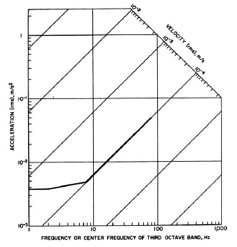
Figure 2. Curve of acceptable levels of building vibration. |
Vibration in buildings can affect the occupants and the structure itself in many ways. Much effort has been expended over the years, particularly in seismically active areas, to build structures to withstand vibration that might result from significant ground motion. Much more commonplace however, is the lower level vibration associated with construction activity, or passing motor vehicles and trains. This may not necessarily cause damage to adjacent structures, but can be uncomfortable to the occupants, reducing their quality of life and/or working efficiency.
Many municipalities have regulations in place to try and limit the amount of building vibration in residences and businesses. These regulations usually set criteria for acceptable vibration levels, but lack standardization in both the measurement technique and the interpretation of the results. The American National Standards Institute (ANSI) S2.71 “Guide to the Evaluation of Human Exposure to Vibration in Buildings” provides recommendations on the magnitudes of vibration which are perceptible to humans and regarded as tolerable by building occupants under different circumstances. The vibration magnitudes are defined explicitly in numerical terms to avoid ambiguity and encourage precise measurement in practice.
Evaluation of the human exposure to vibration usually requires measurement of the levels at a particular structure at various times and correlation to known sources such as passing vehicles or construction activity. Measurements are taken with vibration sensors such as the accelerometers shown in Figure 1. These sensors are arranged in a tri-axial fashion to measure vibration levels in each of three directions simultaneously. The measurements are recorded over some period of time, then analyzed and compared to a curve of acceptable levels shown in Figure 2. This curve is the based on the minimum level of perception among humans and results from significant research over the years into human response to vibration.